25 Sep, 2012, jurdendurden wrote in the 2nd comment:
I would like to know this as well… trying to figure out how to use it in combination with my mud now and having issues…
25 Sep, 2012, jurdendurden wrote in the 3rd comment:
Ok I've got valgrind running my program now, however, I don't know what to do from there. I have a sneaking suspicion there is a memory leak in my questing code. Do I just quest and such and wait for it to crash? Will valgrind then tell me some more information?
25 Sep, 2012, jurdendurden wrote in the 4th comment:
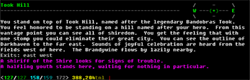
Ok figured that one out pretty fast… seems like I can complete my first quest, check my quest log, then find the next quest, and take it, then it crashes with a Sef fault and this message:
*******@localhost:~/quickmud/area$ –17011– REDIR: 0x40aca30 (strchrnul) redirected to 0x4026c50 (strchrnul)
Segmentation fault
Where do I go from here?
*******@localhost:~/quickmud/area$ –17011– REDIR: 0x40aca30 (strchrnul) redirected to 0x4026c50 (strchrnul)
Segmentation fault
Where do I go from here?
25 Sep, 2012, arholly wrote in the 5th comment:
That's a seg fault. I know what to do with that. Run your mud under gdb and do the same steps. If it is segfaulting, GDB should be able to help you know where it is doing it at.
25 Sep, 2012, Rarva.Riendf wrote in the 6th comment:
Bad code runing under Valgrind will act very differently than code running in gdb and even differently under normal condition.
The reason is that memory is not allocated exactly the same way since code is running under different condition.
May crash running normally, or not at 'random', but not crash using gdb, and usually crash even less using Valgrind.
And even react very differently depending if you run it in 32/64b under Windows or Linux.
Only perfectly valid code actually react the same on all platfrom/all mode.
And segfault may happen everywhere once memory has been corrupted by write error. This is why you should run Valgrind to detect those.
No need to run the code in gdb to see where it happens, just run gdb on the coredump generated. (provided you allowed coredump creation, and removed optimization so you have more usable info in there (like variable value, and a longer stacktrace)
Make a test unit that use all your quest functions, then see what Valgrind output. If there is anything remotly looking like memory is lost, then yes it leaks. If you start have having read/write errors, then you have an even worse problem.
I personlly run and debug and run valgrind on my mud in Eclipse so I only have one tool for all developpement.
The reason is that memory is not allocated exactly the same way since code is running under different condition.
May crash running normally, or not at 'random', but not crash using gdb, and usually crash even less using Valgrind.
And even react very differently depending if you run it in 32/64b under Windows or Linux.
Only perfectly valid code actually react the same on all platfrom/all mode.
And segfault may happen everywhere once memory has been corrupted by write error. This is why you should run Valgrind to detect those.
No need to run the code in gdb to see where it happens, just run gdb on the coredump generated. (provided you allowed coredump creation, and removed optimization so you have more usable info in there (like variable value, and a longer stacktrace)
Quote
Ok I've got valgrind running my program now, however, I don't know what to do from there. I have a sneaking suspicion there is a memory leak in my questing code. Do I just quest and such and wait for it to crash? Will valgrind then tell me some more information?
Make a test unit that use all your quest functions, then see what Valgrind output. If there is anything remotly looking like memory is lost, then yes it leaks. If you start have having read/write errors, then you have an even worse problem.
I personlly run and debug and run valgrind on my mud in Eclipse so I only have one tool for all developpement.
26 Sep, 2012, arendjr wrote in the 7th comment:
Hi arholly (and everyone else interested :)),
In addition to the excellent info Rarva gave, let me give you a simple overview of what you can do with Valgrind and GDB. I'll start with GDB as it's easier to explain, and you appear to have more experience with that already:
In my experience GDB is only useful for debugging crashes (a.k.a. segmentation faults on Linux, bus errors on OS X). GDB will give you a stack trace of where the crash occurs, and allows you to inspect the values of variables. Seeing where the crash occurs plus the state of the application upon crashing is very useful for solving a great amount of bugs. However, when your application crashes the root of the problem may lie somewhere differently from the place where it actually crashes. If you inspect the state of your application through GDB and it just doesn't make sense to you, or after several debugging runs the results tend to vary wildly for no apparent reason, chances are high there's some memory corruption going on, and that's where Valgrind comes into play.
Valgrind is a tool for finding memory related problems. These problems include memory leaks, free'ing memory twice, accessing memory that's not allocated to you (this is what often, but not always, also causes crashes), reading or writing uninitialized variables, etc.. In addition, you can also use Valgrind for profiling to find performance bottlenecks, but that's a different story altogether (you can google for it if you're curious). In order to find memory issues with your application, you typically run Valgrind like this:
valgrind –tool=memcheck <your-application-binary>
While running your application you should see any issues on the console right away as you go. Typically, you will see messages like these:
==12345== Invalid read/write of size X
This typically means your application is reading or writing memory from/to a location that is not allocated to it. Typical causes are trying to access memory through a pointer that has already been freed, accessing through a pointer that has never been initialized, or a buffer overflow.
==12345== Conditional jump or move depends on uninitialised value(s)
This is a typical message that you'll see when you're using the value of some variable, but the variable has never been initialized.
==12345== Invalid free()
This you'll see if you're trying to free the same memory twice, or if you're trying to free memory that wasn't allocated to you in the first place (probably trying to free an uninitialized pointer).
==12345== XX bytes in X blocks are definitely lost in loss record X of X
This is the typical message you will see when a memory leak occurs. Of course the typical way to introduce memory leaks is by allocating memory but overwriting all the pointers to it.
There's a whole bunch more of these messages, that you can find here: http://valgrind.org/docs/manual/mc-manua...
Finally, if you want a good complete manual for using Valgrind, try this: http://valgrind.org/docs/manual/manual-c... and they have a Quickstart guide too: http://valgrind.org/docs/manual/quick-st...
Cheers!
Arend jr.
Random Picks
I was wondering if there is a primer on Valgrind like Gammon did on GDB?
Arholly